Skip to content

Midterm Marcus Merkelbach

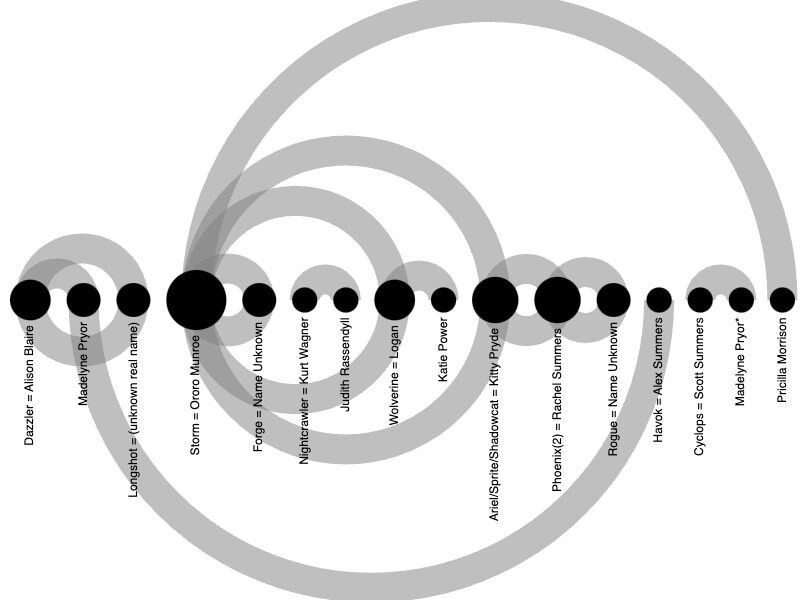
I made a graph of X-men Characters holding hands to analyze the relationships between X-men characters.

  • Midterm
Midterm Marcus Merkelbach

Midterm

Leave a reply
This entry was posted in Uncategorized on October 30, 2023 by admin.

Hello world!

1 Reply

Welcome to WordPress. This is your first post. Edit or delete it, then start writing!
This entry was posted in Uncategorized on October 26, 2023 by admin.

For my midterm project, I wanted to create a graph that would display the closeness in the relationship between various X-men characters in issues 200-249. The dataset I used for this project was titled “uncanny-xmen-200-249-characters.” The dataset was immense as it contained 34 actions enacted by various X-men characters. Having 34 different columns in the original dataset proved to be incompatible with graphing, as the dataset quite simply had too many different types of data. I realized that I had to clean the data set by choosing a singular type of data that would indicate two characters having a close relationship whether it be romantic or platonic. I eventually settled on choosing hand-holding as the data point because generally, two people do not hold hands with one another unless they have a close personal relationship. When graphing the data, I decided to utilize an arc diagram. I chose an arc diagram because it is a type of network graph that allows an individual to see the relationship among nodes. In the graph, I made the source node X-men characters, and I made the target node hand-holding. In the graph, Nodes are displayed on the horizontal axis, and links as clockwise arcs. When an arc connects two nodes, that indicates that those characters have held hands at some point in X-men issues 200-249. 

For the presentation of the website, I chose to include background photos of hamburgers to stay consistent with a previous website I designed which had club sandwiches as the background photo. I also chose a website style that allowed me to have a large display of my graph as the centerpiece of the website. This project really underscores the importance of using the proper graph when displaying data in the digital humanities. An arc diagram was the only type of graph that could accurately display the data in the way I wanted it to be shown.


Proudly powered by WordPress
css.php